|
|

|
Why Use StockCiphering?
I first got interested in the stock market in 1998, when my wife took some money we made
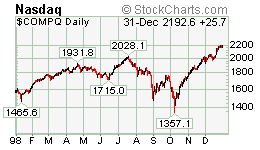
from a garage sale and bought ORCL on October 8 of that year. That day just happened
to be when the Nasdaq hit bottom at 1357.1 (see chart at right). It was also my birthday. So obviously this was
a good sign. Over the next few months I saw that investment almost triple. A friend of mine had also
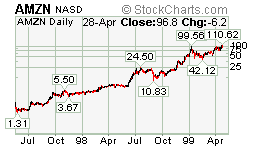
bought AMZN in Jun1997 and sold 22 months later in Apr1999 (see chart at right) for an astounding 6150% profit!
Needless to say, I was hooked on the possibilities of the stock market.
I checked out every book I could find at the library and discovered the intricacies of
technical analysis and the benefits of finding growth stocks. I particularly got interested
in stocks that broke out from consolidations and went on to huge gains (like AMZN did in late 1998).
But I got frustrated reading various financial magazines and newspapers because none of them could
point me in the direction of which stocks were setting up for breakout.
So I created StockCiphering.com gradually over the years in order to help me find big winners.
Below are some of the reasons why I believe StockCiphering.com is an indispensable tool for seeking
out winning stocks.
--Brad Schulz
|


|
Tighter Data Focus
There are literally thousands and thousands and thousands of stocks out there,
including stocks that trade for under $1 and stocks that trade a paltry average of 300 shares a day and also
megacap stocks like Microsoft and General Electric, which tend to move like dinosaurs
because of their sheer size. The StockCiphering.com database only tracks about
1000 stocks total, weeding out illiquid stocks and those with ridiculously low prices.
Stocks with poor long-term growth prospects are also eliminated.
Only stocks with a float of less than 100million shares are included, because a high level
of demand for a stock with a small supply of shares available is a powerful catalyst for
huge price increases.
Seek Out Future Earnings Potential
You can find many websites out there that rank stocks based on past earnings. But what about the future?
True, future earnings growth estimates are just opinions, but that earnings potential does help bolster
the buying interest in a stock.
This is why our Overall Ranking takes into account not only
past earnings, but also puts a big emphasis on future earnings growth in being calculated. Using this ranking,
you can find some potential gems that are under everyone else's radar. A good example is
TMCS, which had poor rankings on past earnings on many websites at the beginning of
2002, while StockCiphering.com gave it an Overall Ranking of
94 because of its large earnings growth estimates for the coming quarters. As the year progressed,
the websites that ranked on past earnings upped their rankings with each passing quarter.
But the Overall Ranking assigned by StockCiphering.com remained in the 80's and 90's during the whole
year.
Avoid Future Earnings Breakdowns
Conversely, some stocks that already have high rankings at websites that rank on past
earnings won't be able to maintain that ranking because there's negative growth in their future. An example
is XTO, which had excellent rankings on past earnings at the beginning of 2002, while StockCiphering.com gave it an
Overall Ranking of 9 because of negative growth estimates for the coming quarters. It was no surprise,
then, when XTO got downgraded by other websites as the year progressed, hitting rock-bottom by the time
August rolled around. StockCiphering.com's Overall Ranking for XTO never went above 15 in all that time.
Discover the "Undiscovered"
We put all our stocks through a vigorous filtering system to find what we call Undiscoverd Growth
stocks. In short, these are stocks with great future earnings growth prospects and yet are
relatively undiscovered in terms of dollar volume and institutional support. One of our
Cream of the Crop screens outlines Undiscovered Growth stocks that have a
1-Year Performance Ranking of 70 or above. Only about 4-5% of all
the stocks in our database pass all these tests and may be a good resource for those of you
coming primarily from the fundamental side in searching out stocks.
Scan Charts Quickly
On the technical side, all of StockCiphering.com's stock screen tables let you see up to
10 charts at a time (thanks to StockCharts.com) with a click of a mouse. A good chart reader
can glance through those charts and find ones that look good from a Cup/Handle or Flat Base
perspective very quickly. Our screens specifically tell you which stocks are setting up and
consolidating in certain ways and which stocks have broken out, and you can view their charts
quickly, 10 at a time, instead of stumbling upon a chart by chance that happens to show up in
a financial magazine or newspaper.
Early Risers
Many websites and financial publications talk about the RS Line moving into new high ground
(before a stock's price has hit new highs), but there is no process available for screening those stocks.
StockCiphering.com does find those stocks and puts them in the
Early Risers screen and also into the Express Checkout: Setups
and Consolidations screen. These stocks are especially good prospects when
the markets are hitting bottom or coming up from a bottom.
Be Ready For The Next Trading Day
Our DayWatch screen will let you know which stocks and Business Categories
were the big-volume winners and losers for the day. Soon after the market closes, you will already have a
good idea of which stocks may appear in your financial newspaper the next morning.
Our Nasdaq Weather Report on our Home Page will also let
you know whether the day was considered an accumulation day or a distribution day on the Nasdaq exchange.
Read more about how and why our screens were developed...
|
|

